Draws Are Priced Perfectly. Until a Press Meets a Possession Team.
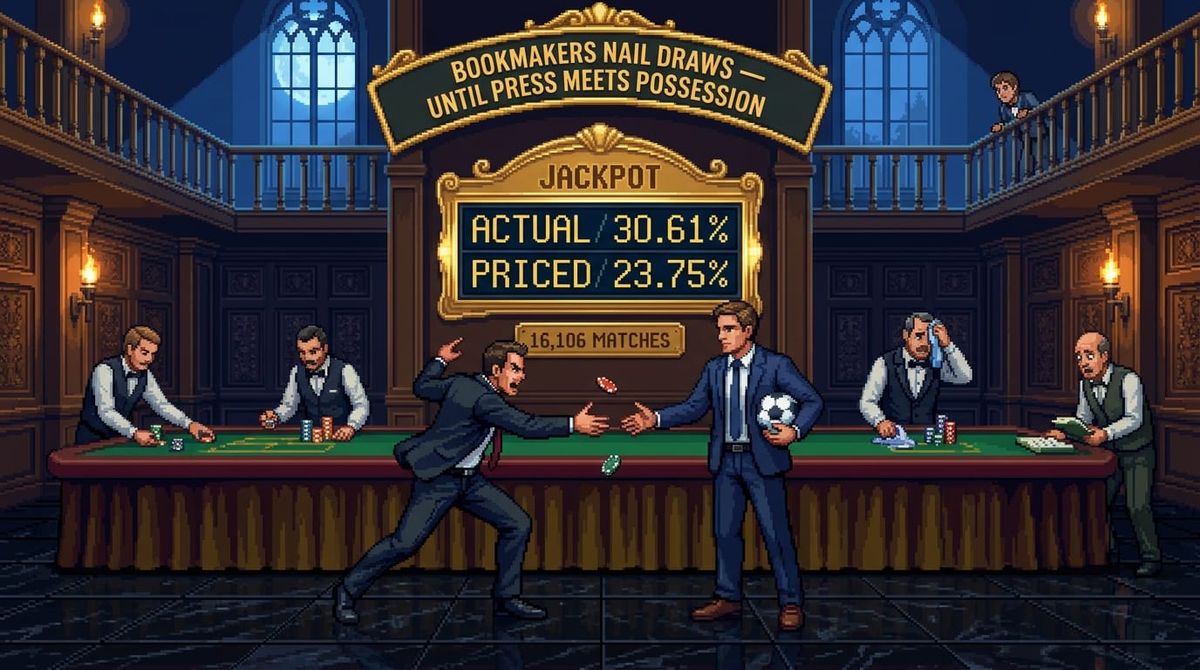
Across 16,106 matches the actual draw rate sat half a point off the implied rate. Then a high press meets a possession side: 30.6% draw, against 23.8% priced, and the calm average falls apart.

The betting market prices draws carefully — yet certain style matchups consistently outrun the implied probability by 5+ percentage points. We found the pattern.
Every draw is a negotiated stalemate, and bookmakers price it with care — the draw option typically carries the highest margin of any result. But what if certain tactical-style matchups produce stalemates that the market consistently fails to anticipate? We set out to measure exactly that: how far the actual draw rate in each style-versus-style pairing diverges from what Pinnacle's closing odds implied. 16,106 matches from Europe's big five leagues, nine seasons, closing odds from the sharpest line in sports betting.
The Draw Blind Spot
Do certain tactical matchups produce more draws than the market prices? Across 12,603 club matches from Europe's big five leagues (2017/18–2025/26) some pairings diverge from closing-odds expectations by over 5 percentage points.
The gap the market keeps missing
The headline finding is clean. When a Gegenpress side faces a Positional side, actual draws land at 30.6% — against a Pinnacle-implied rate of just 23.8%. That is a +6.9 percentage-point surplus (95% CI 24.6–37.4%, n=196). The mirror pairing — Gegenpress hosts vs Positional visitors — produces almost the same gap: +6.5pp. These are not the same matches; they just share the same structural tension. When a high-press side meets a possession side, the game tends toward a knife-edge stalemate that the market is slow to price.
The defensive duel surprise
At the other end of the possession spectrum, Low-block vs Low-block draws land at 30.9% — a +2.8pp surplus on the implied rate (n=567). This one is perhaps more intuitive: two teams trying not to lose each other out tend to succeed. The market nods to this; the surprise is that it still underestimates the frequency of the defensive draw.
Where the market over-prices draws
The largest negative surprise belongs to Low-block vs Gegenpress — 19.2% actual against 24.2% implied (-5.0pp, n=255). The market prices this pairing as if draws will happen roughly as often as the rest — but they don't. When a high-pressing side takes on a possession team, the intensity asymmetry tends to produce a result.
La Liga leads on draws
By league, La Liga produced the most draws — 26.5% of matches ended level. The Premier League was the least draw-prone at 23.4%, consistent with its reputation for end-to-end intensity. The global draw rate across all 16,106 matches stands at 25.2% against an implied rate of 24.8% — a tiny overall surplus of +0.5pp.
What this means — and what it doesn't
These are real patterns in the historical record, not noise. But a 5pp draw-surprise doesn't become a betting strategy without a key caveat: Pinnacle's closing line is the sharpest number in the market, and individual match edges are absorbed before kick-off. The matchup style is one signal among many. What this data does tell you is about expectation calibration — when you're watching a Gegenpress side face a Positional one, an extra stalemate every 20 matches compared to the "expected" rate is a meaningful adjustment to your model.
Method. 16,106 matches from the Premier League, Bundesliga, Ligue 1, Serie A, and La Liga (2017/18–2025/26). Draw surprise = actual draw% minus vig-adjusted implied draw% from Pinnacle closing odds (PSH/PSD/PSA), with Bet365 fallback where Pinnacle is unavailable. Implied draw probability vig-adjusted as (1/PSD) / (1/PSH + 1/PSD + 1/PSA). Style classification — Positional (A), Gegenpress (B), Low-block (D) — from the FASTMaster style map. 3,218 matches with both teams clearly styled. Wilson 95% CI on actual draw rate: margin = 1.96 × √(p(1−p)/n). Ordered cells: home style × away style. Source: football-data.co.uk odds + results. — Fastmaster Intelligence.