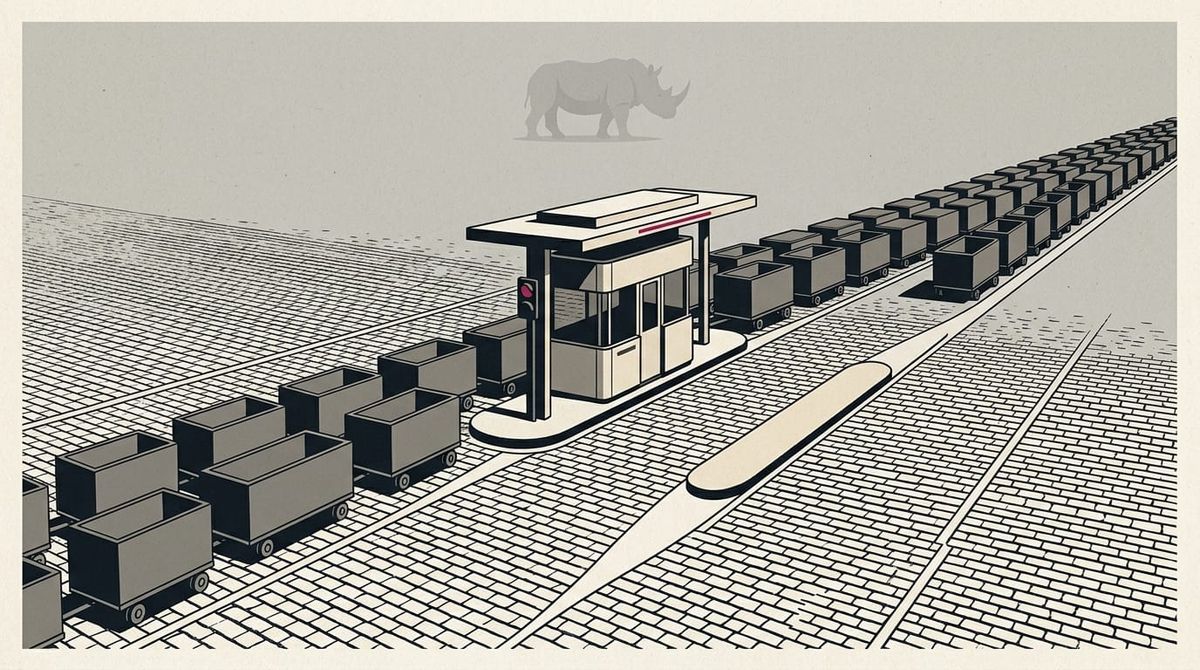
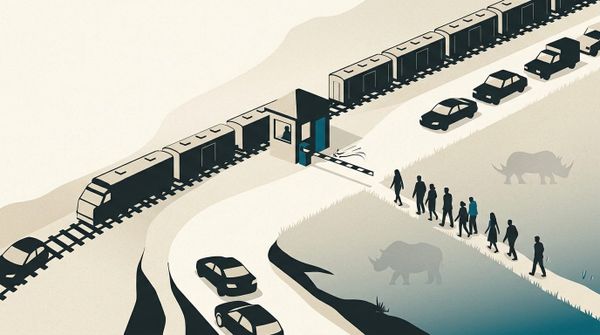
The companies that run your smart-TV menu — Roku, Amazon, Samsung — have turned the home screen into a tollbooth, taking an estimated $2.6bn a year from the people who make and stream the shows.
The software that runs the menu on your smart TV has become a tollbooth. Roku, Amazon and Samsung control the home screen, the viewing data and the ad slots — and they now charge the people who make and stream shows for the privilege of reaching their own audience. Our middle estimate is $2.6bn pulled out every year, roughly 6.76% of the $38bn the sector earns, with a worst case of $3.5bn.
The market treats this as good news for the gatekeepers and ignores the cost to everyone else. Roku's software revenue is up 18% to $4.145bn at a 58% margin — priced as Roku's win, not as a tax on content owners.
Roku (ROKU) runs 38% of automated US TV ad sales and takes about 20% on sign-ups. Amazon (AMZN) keeps 30% of app makers' ad slots on Fire TV. Samsung (005930.KS) made $1.2bn from its own free channels using its home screen. Warner Bros. Discovery (WBD) and Paramount Global (PARA) must pay these tolls to reach viewers, squeezing already thin streaming profits.
Why this matters. The companies that run the menus on your smart TV — Roku, Amazon, Samsung — have quietly turned the home screen into a tollbooth, taking an estimated $2.6bn a year from the people who actually make and stream the shows. Content owners pay to reach their own viewers and have no real way around it. Any lender, operator or investor backing a streaming business is funding a margin that the TV-software owner can squeeze whenever it chooses.
Blindside · TV & Streaming
TV Operating Systems Become Tollbooths
The companies that run smart-TV menus now tax everyone who streams through them
Imminent
86
Blindside index
What drives it — drag to test
each slider starts at our cited estimate — drag to see the range
Share of TV ad space the menu-maker controls38%
Sourced — Roku alone handles 38% of automated US TV ad sales; it owns the home screen and viewing data.
Extra cut the menu-maker skims from streamers15%
Sourced — Amazon Fire TV claims 30% of app ad space; Roku takes about 20% on sign-ups.
Extra money from watching the screen tracks+12%
Our judgment — US screen-tracking data is worth $1.25bn; smart TVs are 64.6% of it, and the TV maker owns the signal.
Time to impact
1–4 yearsImminent
now3 yrs7+ yrs
When the financial hit begins to land, on our read.
How to read this. Drag any slider to test your own number — the chart and index update live. The likelihood and the locked facts stay put.
Yearly fees pulled from content owners
$2.6bn6.76% of sector
Dark line = most likely · faint lines = low–high (8 in 10 outcomes land between) · shaded band = what outside analysts expect
Our estimate lands within what outside analysts expect ✓
Chance this is a permanent shift, not a blip
71%
Average of five independent reads (range 50–82%):
The track record74%
Whoever owns the decision screen — app stores, search, marketplaces — reliably charges a fee on everyone riding through.
How it works82%
Amazon's automatic 30% ad grab makes the toll explicit; Roku already runs 38% of automated TV ad sales.
The skeptic's case50%
Big streamers like Netflix, Disney and YouTube can dodge the menu with their own apps, ad tools and logins.
What Roku's results show70%
Roku's software revenue is up 18% at 58% margin — the market already pays the toll, priced as Roku's gain.
What TV makers are doing78%
TV makers are openly switching from cheap hardware to lucrative home-screen advertising — that menu is the asset they are building.
Fixed — the sliders change the size of the hit, not the odds it's permanent.
Why this matters
The companies that run the menus on your smart TV — Roku, Amazon, Samsung — have quietly turned the home screen into a tollbooth, taking an estimated $2.6bn a year from the people who actually make and stream the shows. Content owners pay to reach their own viewers and have no real way around it. Any lender, operator or investor backing a streaming business is funding a margin that the TV-software owner can squeeze whenever it chooses.
Most exposed companies
Roku ROKU · Amazon AMZN · Samsung Electronics 005930.KS · Warner Bros. Discovery WBD · Paramount Global PARA
🔒
The facts — locked
measured, not editable
38%
of US programmatic CTV ad sales run through Roku OS
Roku / programmatic index (Q1 2025)
30%
of dev ad impressions Amazon Fire TV now mandates for itself
eMarketer (Sept 2025 developer policy)
~20%
Roku's take on streaming sub sign-ups through its OS
Roku FY2025 shareholder letter
$4.145bn
Roku platform revenue, +18% YoY (one OS)
Roku FY2025 8-K
$1.25bn
US ACR data market; smart-TVs = 64.6% of it
Mordor / Precedence (2025)
$1.2bn
Samsung TV Plus revenue, OS-owned FAST/home screen
Omdia (2025)
28% / 23%
Roku / Samsung share of CTV platform access
Parks Associates (Q1 2026)
Attention is climbing. the market is starting to price this in — the early window is closing.
The TV-software gatekeepers are on track to pull $2.6bn a year from US streaming content owners in the middle case (worst case $3.5bn, best case $1.8bn), about 6.76% of the $38bn the sector earns. That figure is anchored by Roku handling 38% of automated US TV ad sales, Amazon claiming 30% of app makers' ad slots, and a 20–30% cut on subscriptions signed up through the software. This is a lasting squeeze on content owners' profits, not a passing cost; our threat score is 86 out of 100, with a 71% chance it sticks.