
Teams Win More Without Their Star. The Reason Is a Fixture Trick.
Across 1,011 matches, the top 20 nations won 61.5% without their talisman and 56.6% with him. Then you filter to elite opponents and it flips — 36.0% with the star, 29.4% without. The explorer lets you take the illusion apart match by match.

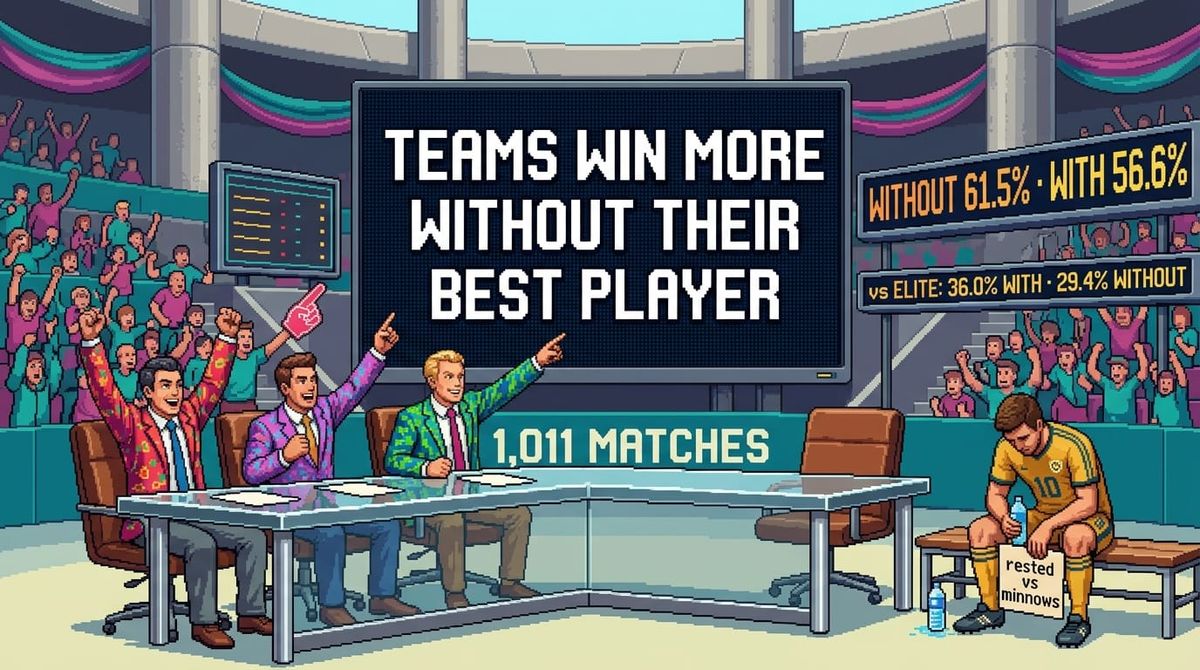
Across 1,011 internationals, the twenty best teams in the world won more often when their star sat out than when he started. It reads like proof the talisman is overrated. It is proof of something sneakier — and the full match ledger below lets you take it apart yourself.
Fastmaster Intelligence · Data Desk
Here is a stat built to start arguments. Take the twenty highest-ranked national teams on the planet and their twenty defining players — Messi, Mbappé, Kane, Vinícius, De Bruyne, the lot. Across every competitive match they played from May 2021 to May 2026, line up the games each star started against the games he missed entirely. The teams won 56.6% of the 686 games their talisman started. They won 61.5% of the 260 he sat out. They scored more and conceded fewer without him: a goal difference of +1.38 a game with him on the bench against +1.04 with him on the pitch.
Taken at face value, twenty of the finest footballers alive are a mild handicap to their own countries. Taken at face value. The number is real — you can rebuild it from the ledger below — but the conclusion is a magic trick, and the misdirection is hiding in plain sight.
Sort the same matches by who was on the other side.
The “better without him” gap does not hold up evenly. It does not hold up at all where it would matter most. Against elite opposition — the world’s top twenty — the teams won 36.0% of the 228 games their star started and only 29.4% of the 68 he missed. Their goal difference against that company was break-even with him (+0.01) and went negative without him (−0.04). Against strong sides (ranked #21–50) it is a dead heat: 55.2% either way. The entire “advantage” lives in one band — the mid-tier, where the win rate jumps from 66.1% with him to 76.9% without — and evaporates again against minnows, where both versions of the team win nine in ten.
| Opponent | Win (starts) | GD/g | Win (sits out) | GD/g |
|---|---|---|---|---|
| Elite #1–20 | 36.0% (228) | +0.01 | 29.4% (68) | −0.04 |
| Strong #21–50 | 55.2% (194) | +0.94 | 55.2% (67) | +0.88 |
| Mid #51–100 | 66.1% (174) | +1.49 | 76.9% (78) | +1.65 |
| Minnow #101+ | 93.3% (90) | +3.01 | 91.3% (46) | +3.65 |
| All opponents | 56.6% (686) | +1.04 | 61.5% (260) | +1.38 |
Win rate and goal difference per game, talisman starting vs sitting out, by opponent strength. (One unranked opponent — a single sat-out game — is omitted from the tier rows.)
So the headline inverts exactly where the football is hardest. Spain are the cleanest example in the set: with Yamal starting against elite opponents they won 72.7% of 11 matches; in the 16 elite games he did not play, they won 43.8%. The star helps most precisely against the teams good enough to punish his absence.
Read it yourself
The explorer below is the whole ledger — 1,011 rows, one per match, nothing aggregated away. It splits your selection three ways: games the talisman started, came on as a substitute, and did not play. Narrow by opponent and watch the gap move.
FMI Data Desk · The 1,011-Match Explorer
The 1,011-Match Explorer
Every competitive A-international these twenty teams played, in one place. Pick a team and slice the record by opponent strength, venue, result, or stage — the with-vs-without summary recomputes live, and the table below shows the actual matches. Add the Opponent filter to watch the "better without him" gap dissolve.
| Date | Opponent | Ven | Competition | Score | Res | Talisman |
|---|
Window: 1,011 competitive A-internationals (no friendlies), May 2021–May 2026, for the 20 highest-ranked FIFA national teams. With/without compares START to DNP (SUB shown separately). Opponent tier = FIFA ranking points, 1 Apr 2026 snapshot (Elite #1–20 · Strong #21–50 · Mid #51–100 · Minnow #101+). Penalty shootouts counted as draws. The win-rate and goal-difference edges that appear "without him" are largely a softer-fixture selection effect — filter by Opponent to see it. Sources: national-football-teams.com (results) · FBref / Transfermarkt (start status). Every row reproducible via matches_data.py.
Why the "without" column cheats
Why does the pooled number lie? Because the two piles were never the same fixtures. A manager rests his best player against the teams anyone beats and plays him against the teams that bite — so the “without” column comes pre-stocked with easy games. When the talisman starts, a third of his opponents are elite, the world’s top twenty (33.2%). When he sits, that share falls to 26.2%, while soft minnow fixtures climb from 13.1% to 17.7% to take their place. The pattern holds down the tiers: the matches he misses skew, every time, toward the beatable ones. The “without” team isn’t better. It is playing weaker people.
Statisticians have a name for this: Simpson’s paradox, where a pattern that holds across a whole pile reverses inside every part of it once you sort the pile honestly. Here the sorting key is opponent strength, and the explorer above puts it in your hands — set Opponent to Elite and watch the gap die; set it to Minnow and watch it balloon. Add a team, a venue, a result. The selection effect shows up under almost every cut, because it was baked into how the minutes were handed out in the first place.
What the data won't pretend to know
A few honest limits. The bench is too thin to theorise on: only 65 of the 1,011 matches were games the talisman came on as a substitute, so the three-way split shows them but leans on starts-versus-misses. Individual goals are left out on purpose — the per-match scorer column is incomplete in the source logs, and the dataset stands on team goals rather than guess. And the matches are deliberately not carved into “group stage” versus “knockout”: more than two hundred fixtures carry a bare tournament name with no round attached, and labelling them would be inventing data the records don’t hold.
None of that touches the core finding, because the core finding is a subtraction the data makes for you. The team is not better without its best player. It is better-fixtured without him — and once you hold the opponent constant, the player you were told to doubt is the one keeping the goal difference above water against the only teams that count.
Method. 1,011 competitive A-internationals (no friendlies), May 2021 – May 2026, for the twenty highest-ranked FIFA national teams and their defining player. “With” = the talisman started; “without” = he did not play; 65 substitute appearances are shown separately and excluded from the with/without contrast. Win rate = wins ÷ games; goal difference per game = (goals for − goals against) ÷ games; both computed live on whatever slice you select. Opponent strength is bucketed from current FIFA ranking points (1 Apr 2026 snapshot): Elite #1–20, Strong #21–50, Mid #51–100, Minnow #101+. Goals for and against are complete in the source logs; the per-match goal-scorer column is not used. Match results from national-football-teams.com; start and did-not-play status from FBref and Transfermarkt match logs. Penalty shootouts counted as draws. Every figure on this page is recomputed from the match ledger at build time. — Fastmaster Intelligence, Data Desk.