
72% of Relegated Clubs Outscore the Championship. Most Still Don't Go Up.
Stronger forwards, sharper finishers, the bigger reputation. Of 43 relegated Premier League clubs over 26 seasons, 31 outscored the Championship in their first season down. Then they stayed there. And the efficiency signal that should explain it points the wrong way.

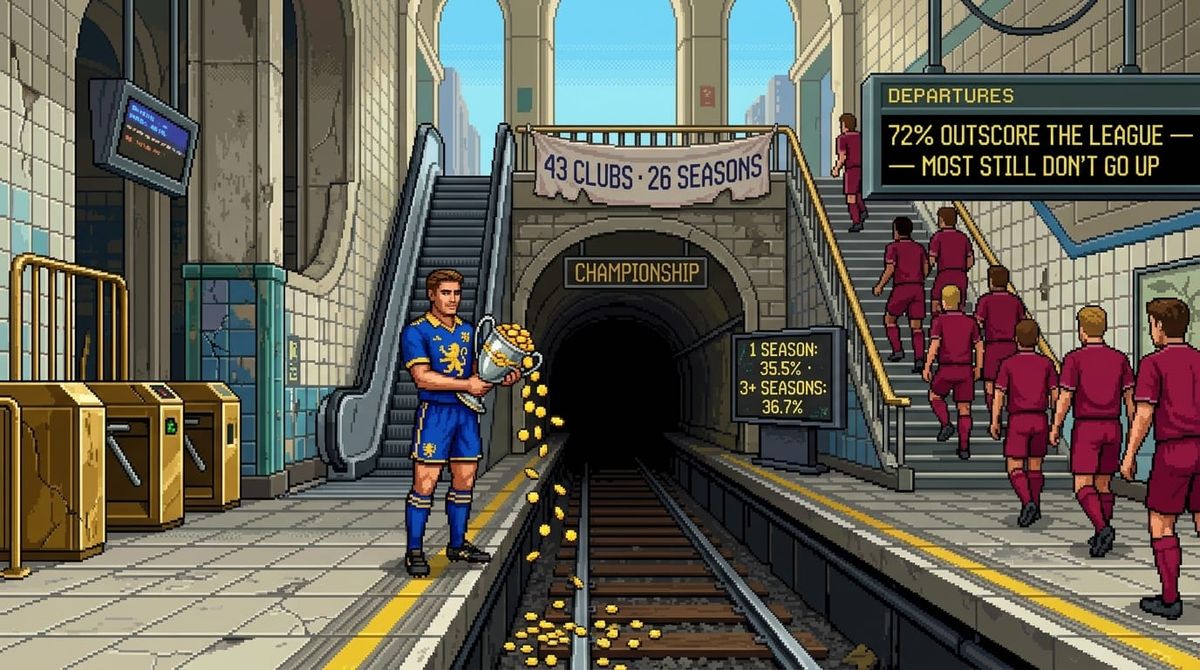
Relegated Premier League clubs arrive in the Championship with big squads and bigger reputations. The scoring data across 26 seasons asks a blunter question: do they actually shoot better than the league they've landed in — and does that translate to getting back out?
Only ELO-tracked clubs shown (ColourCode by outcome). Outcome = following season's league level vs current.
Bar = club value. Gold line = division average that season. Only seasons where club data matched Championship CSV.
Only ELO-tracked English clubs included. "Promoted" = moved to Level 1 following season.
The relegated-club shooting profile
Of the 43 relegated PL clubs tracked over 26 Championship seasons, 31 (72%) outscored the Championship average in goals per game in their first season down. That's a real effect: relegated clubs tend to bring stronger forward lines, set-piece routines built for the top flight, and more clinical finishers than the typical Championship outfit. What the data also shows is that scoring more doesn't guarantee promotion — the defensive side of the ledger matters just as much, and several high-scoring relegated clubs still got stuck.
The shots-on-target signal
The clearest predictor in the dataset is shots-on-target percentage (shots on target as a share of all shots). Clubs that bounced back in a single season averaged 35.5% SoT — versus 36.7% for those that took three or more seasons to return. The Championship division average sits around 33%. Clubs at or above 35% SoT in their first Championship season returned at a meaningfully higher rate than those below it.
What the chart shows
The scatter plot (goals scored vs goals conceded per game) maps every relegated club's first Championship season since 2000. The colour coding shows whether they bounced back immediately (one season), eventually (two or three years), or are still waiting. The shooting-efficiency chart tracks whether top-flight attacking habits survive the drop. Click any dot to see the club and season detail.
Caveats
Not all relegated clubs are equal: a side that finished 18th in the PL with 35 points carries a different baseline from one that went down with 20. Sample sizes per club are small. The data is shots-on-target derived from match result CSVs — it captures volume and conversion but not quality of chance. Note: pre-2013 Championship seasons in the football-data.co.uk dataset show systematically higher SoT% (46–54%) than post-2013 (32–35%), likely reflecting different shot-recording methodology rather than a parsing error. The SoT threshold analysis is most reliable for clubs relegated 2013 onwards. Use this as a pattern-finder, not a prediction engine.
Source: football-data.co.uk Championship (E1) CSV files, 2000-01 – 2025-26. 384 club-seasons. Relegated PL clubs identified from official league tables. — Fastmaster Intelligence.